It's now time of year to look ahead to global macro prospects for 2016. I have posted similar outlooks for the past two years (here and here) and followed up at the end of each year with an assessment of those forecasts (here and here). I will state again why I find this exercise useful. I assemble consensus views on global growth, inflation, interest rate and exchange rate outlooks not because I have faith in forecasts. I do it because the consensus view on the year ahead is presumably already built into market prices. The consensus view, as Howard Marks says, is "what 'everyone knows' and is usually unhelpful at best and wrong at worst". What will move markets in 2016 is not the current consensus forecast, but the ways in which actual economic developments diverge from that consensus.
With the foregoing caveat in mind, here, in a nutshell, is what the consensus view is telling us about 2016:
- global real GDP growth is expected to be stronger than 2015;
- global inflation is expected to be higher than in 2015;
- The Fed is expected to hike the Fed Funds rate by 50 or maybe 75 basis points and central banks in the UK and Mexico are also expected to tighten at least once;
- The Eurozone, Japan and Canada are all expected to leave their policy rates unchanged, while one 25 bp rate cut is expected in China, India, Australia and Korea;
- In the DM, 10-year government bond yields are expected to rise in all of the economies we track except Australia; In the EM, yields are expected to rise modestly in China, Korea and Mexico, but to fall in India, Russia and Brazil.
- After strengthening against all the currencies we track in 2015, the US dollar is expected to turn in a more mixed performance. USD is expected to strengthen further against EUR, AUD, CNY, KRW, INR and BRL. However, by the end of 2016, the USD is expected to be weaker against JPY, GBP, CAD, and RUB.
- After poor performances in 2015, equity strategists tell us that US and Canadian stock markets are expected to post gains of about 5.5% and 10%, respectively.
If these consensus forecasts sound familiar, thats because they are very similar to forecasts made at the end of 2013 and the end of 2014. Each year, global growth was expected to pick up, global inflation was expected to move higher, the Fed was expected to lead global tightening, bond yields were expected to rise and North American stocks were expected to rally. Both 2014 and 2015 witnessed big macro forecast misses by the consensus. These misses were characterized by weaker than expected global real GDP growth and inflation, lower than expected bond yields, greater than expected USD strength and weaker than expected stock price gains. Are we being set up for similar forecast misses in 2016 or will this be the year when the consensus is correct and things turn around?
Global Real GDP Growth Forecasts
Last year at this time, global growth was expected by the IMF to pick up to 3.8% in 2015 while global commercial bank economists expected a more modest acceleration to 3.4%. Instead, 2015 global growth is now estimated to have slowed to 3.1%.
This year, forecasters tell us once again that global growth will pick up in 2016 to 3.6% (IMF October forecast), or to 4.0% (OECD December forecast), or to 3.4% (average of global commercial bank forecasts).
2016 real GDP growth is expected to be stronger almost everywhere, but with the notable exceptions of the US and China. Economies with the largest consensus forecast growth pickup include Canada (1.9% in 2016 vs 1.2% in 2015), Mexico (3.0% vs 2.5%), Japan (1.1% vs 0.7%), India (7.8% vs 7.4%), Australia (2.6% vs 2.3%), and Eurozone (1.8% vs 1.5%).
While global growth is expected to be a bit stronger in 2016, the divergence between DM and EM growth performance is expected to continue. EM growth is consistently higher than DM growth, but the important divergence is that, for a third consecutive year, DM economies are expected to grow at or above their trend (or potential) rate of growth, while most EM economies are expected to grow below their trend rate. In the chart below, the blue bars show the 2016 consensus growth forecast versus the OECD estimate of the trend growth rate for each economy.
In 2016, the larger DM economies are expected to grow at an above trend pace, while Canada and Australia and are expected to grow at trend. In contrast, three of the larger EM economies are expected to grow well below trend: Brazil (3.4% below trend), Russia (1.5% below trend) and China (0.4% below trend).
In the chart above, the red bars show the latest OECD composite leading indicators (CLIs) versus trend for each of the economies. As was the case a year ago, these CLIs generally support weaker 2016 growth than economists are forecasting, with a few exceptions.
In the DM economies, the leading indicators suggest that growth could surprise on the downside, especially in US, UK, Japan and Canada. In the EM economies, CLIs suggest that growth could be weaker than expected in China, India and Mexico, but stronger than expected, although still below trend, in Brazil and Russia.
Global Inflation Forecasts
Global inflation has consistently fallen short of expectations since 2013. This has occurred in spite of unprecedented efforts by central banks to fight disinflation.
A year ago, global inflation for the entire set of world economies was expected by the IMF to edge up to 3.8% by the end of 2015 from 3.7% at the end of 2014. By October 2015, the IMF had cut its year-end 2015 global inflation forecast to 3.5%. Meanwhile, a year ago, global commercial bank economists expected weighted average inflation for 12 major economies we track to move up to 2.8% in 4Q15 from 2.1% in 4Q14. These same economists now expect that weighted average inflation for these countries fell to 2.0% in 4Q15. For 2016, the global commercial bank economists forecast that weighted average inflation for the 12 countries will rise to 2.3% in 4Q16. The OECD expects an even bigger acceleration fore the 12 countries to 2.5%.

These forecasts, many of them made between early October and early-December, may already subject to downward revision. Crude oil prices ranged from $43 to $51 per barrel during the period these forecasts were made with expectations that prices would firm further heading into 2016. Instead, in the wake of the December OPEC meeting, the price has fallen to $36/bbl in late December and looks likely to remain depressed for a considerable period of time.
In most countries, inflation can be expected to remain weak. Considerable slack remains in the global economy, especially in EM economies. Wage growth remains subdued. Commodity prices are likely to remain weak. Inflation expectations are stable and soft.
Other Non-Consensus Views
Some economists, who are not part of the consensus, have a much darker view of 2016 prospects. One such economist is David Levy, of the Jerome Levy Forecasting Centre, which has a long and enviable forecasting track record.
In a recent interview with Barron's, Levy made the following highly contrarian statements:
Levy: [T]here is no way the U.S. by itself is about to keel over. The danger is not so much that we’re going to start to slide sharply, but rather that conditions overseas will become much rockier.
Barrons: Which could pull the U.S. into a recession?
Levy: Yes, and there are several reasons why. Such a scenario has never happened, certainly not in modern history. There is no postwar recession prior to which the U.S. economy was doing fine, only to get knocked down by the rest of the world. That’s one reason people don’t see the risk. But the emerging markets are not just going into a recession, they are going through a secular adjustment. .... We expect not only a global recession, but also general asset deflation, aggravated by the fact that there is no room to cut interest rates at the major central banks.... Bit by bit, the global economy is falling into recession, with the U.S. bringing up the rear. ...We expect that the Fed will reverse course later next year. In all probability, the slowly spreading global recession will intensify and ultimately engulf the entire planet. It’s at least 2 to 1 that we’ll be in a recession at the end of 2016.
Levy is not alone in warning that 2016 could fall well short of consensus forecasts. Albert Edwards at SocGen, Niall Ferguson of Harvard, Russell Napier, and Lakshman Achuthan of ECRI are also warning of the likelihood of weaker growth or recession.
I'm not suggesting that we should toss the consensus forecast in the trash and use Levy's quite plausible forecast as a base case. But I am suggesting that we should apply a hefty discount rate to the consensus and consider the risks around the benign outcome that reflects "what everybody knows".
Conclusions and Questions
2015 turned out to be a third consecutive year in which global growth was modestly disappointing, but the real story for markets was the divergences in real GDP growth. Will the divergences of 2014-15 continue? If so, the US Fed will likely be joined by the Bank of England and perhaps a few other central banks in tightening monetary policy in 2016, while the ECB, BoJ and PBoC will likely maintain their current accommodative policies or ease further. In this scenario, the US$ is likely to continue to appreciate against currencies of countries whose central banks remain accommodative. Further appreciation of the US dollar combined with below trend growth in China, Brazil and Russia will, barring a major geopolitical event, wii likely continue to weigh on commodity prices and the currencies of commodity exporting countries.
The questions one should ask about 2016 consensus forecasts are the same as we asked a year ago:
- Can the macro divergences between above-trend growth in some key DM economies and below-trend growth in key EM economies be sustained without serious financial instability in some countries and significant volatility in global currency and financial markets?
- Can commodity prices stabilize and recover even as the USD continues to rally and global commodity supply continues to outpace global demand.
- Can China and other EM economies prevent hard landings for their over-leveraged economies?
- Can Canada and Australia, with overheated housing markets, rebound to grow at or above trend after a sharp fall in commodity prices and as the Fed continues to raise its policy rate?
- Will we look back on 2016 as yet another year that started with optimistic forecasts and ended with disappointment?
A year ago, my answers to these questions were: No, No, Don't Know, Unlikely, and Probably. I can see little reason to change these answers as we head into 2016. In the near future, I will turn to the question of how Canadian investors should think about 2016 as another year with macro risks skewed to the downside.
Ted Carmichael is Founding Partner of Ted Carmichael Global Macro. Previously, he held positions as Chief Canadian Economist with JP Morgan Canada and Managing Director, Global Macro Portfolio, OMERS Capital Markets.
It is time to review how the macro consensus forecasts for 2015 that were made a year ago fared. It's not only interesting to look back at the notable global macro misses and the biggest forecast errors of the past year, it also helps us to understand 2015 investment returns.
Real GDP
Since the Great Financial Crisis (GFC), forecasters have tended to be over-optimistic in their real GDP forecasts. That was true again in 2015. In the twelve major economies tracked in this blog, real GDP growth fell short of forecasters' expectations in ten and exceeded expectations in just two economies. The weighted average forecast error for 2015 was -0.46 percentage points, almost twice as large as the 2014 error.
Based on current estimates, 2015 real GDP growth for the US and fell short of the December 2014 consensus by 0.5 pct pts. The biggest downside misses were for Brazil (-4.6 pct pts), Russia (-2.7), Canada (-1.2), Korea (-1.1), Australia (-0.8), and Mexico (-0.8%). India beat forecasts by 1.1 pct pts. On balance, it was a fifth consecutive year of global growth trailing expectations.
CPI Inflation
Inflation forecasts for 2015 were seriously too high. Ten of the twelve economies are on track for significantly lower than forecast inflation, while inflation will be higher than expected in two countries. The weighted average forecast error for the 12 countries was a massive 1.7 pct pts.
The biggest downside misses on inflation were in China (-3.6 pct pts), Korea (-2.7), Mexico (-2.5%), India (-2.4), the UK (-2.3), the US (-1.9%) and Japan (-1.9%). The biggest upside misses on inflation were in countries that experienced large currency depreciations, including Russia (+5.8) and Brazil (+3.3).
Policy Rates
Economists forecasts of central bank policy rates for the end of 2015 anticipated too much tightening by DM central banks and too little easing for most EM central banks.
In the DM, the Fed, the Bank of England failed to tighten as much as expected. The Reserve Bank of Australia and the Bank of Canada, which were also expected to tighten, unexpectedly cut their policy rates. In the EM, the picture was more mixed. In China and India, where inflation fell more than expected, the central banks eased more aggressively than expected. In Russia and Brazil, where inflation was much higher than expected, Russia's central bank eased less than expected and Brazil's central bank was forced to tighten much more than expected.
10-year Bond Yields
In nine of the twelve economies, 10-year bond yield forecasts made one year ago were too high. Weaker than expected growth and inflation in most countries pulled 10-year yields down almost everywhere compared with forecasts of rising yields made a year ago.
In all of the DM economies we track, 10-year bond yields surprised strategists to the downside. The weighted average DM forecast error was -0.54 percentage points. The biggest misses were in Canada (-1.01 pct. pt.), the UK (-0.90) and the US (-0.85). In the EM, bond yields were lower than forecast where inflation fell in China, Korea and Mexico, but much higher than expected where inflation rose sharply in Brazil and Russia.
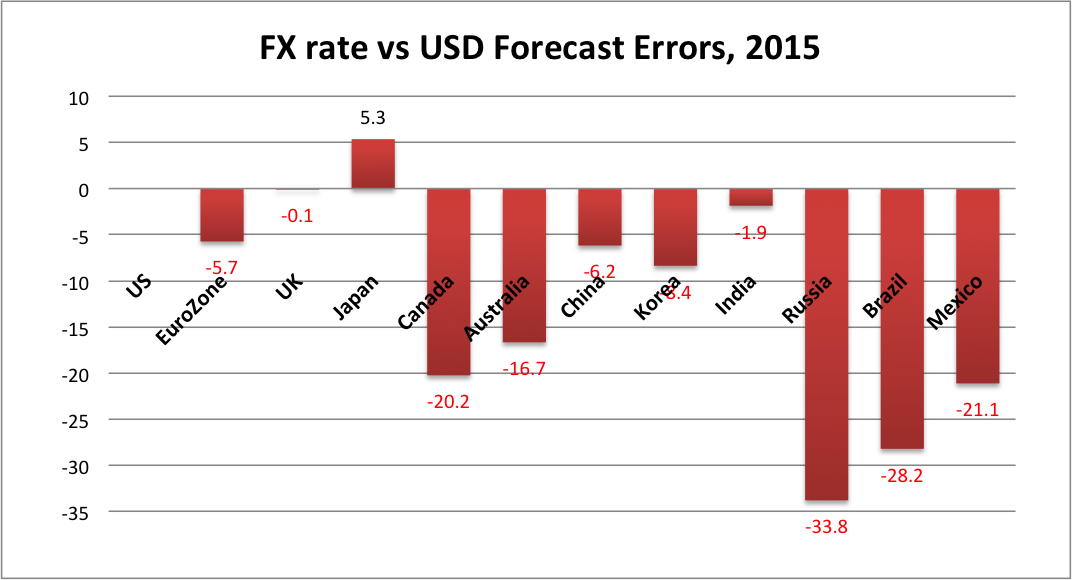
Exchange Rates
The strength of the US dollar once again surprised forecasters. The USD was expected to strengthen against most currencies, but not by nearly as much as it did. On a weighted average basis, the 11 currencies depreciated versus the USD by about 8.1% more than forecast a year ago.
The USD was expected to strengthen because many forecasters believed the Fed would begin to tighten around mid-2015. While the Fed had been promising to tighten this year, it found various reasons to delay, with the first tightening finally occurring on December 16. If everything else had been as expected, the Fed's delay would have tended to weaken the USD. But everything else was far from as expected. Most other central banks eased policy by more than expected. In addition, oil and other commodity prices weakened more than expected so that commodity currencies like RUB, MXN, CAD and AUD weakened much more than forecast.
The biggest FX forecast miss was, not surprisingly, the RUB, more than 30 percentage points weaker than forecast a year ago. Other big misses were for BRL (-28.2 pct pts), MXN (-21.1), CAD (-20.2) and AUD (-16.7). JPY was the only currency that depreciated less than forecast versus the USD.
North American Stock Markets
A year ago, equity strategists were cautiously optimistic that North American stock markets would turn in a solid, if unspectacular, performance in 2015. However, in a year when the major global macro surprises were weaker than expected real GDP growth and much lower than expected inflation reflecting sharp declines in commodity prices, equity performance failed to live up to forecasts. I could only compile consensus equity market forecasts for the US and Canada. News outlets gather such year end forecasts from the high profile US strategists and Canadian bank-owned dealers. As shown below, those forecasts called for a 7.5% gain in the S&P500 and a 6.2% rise in the S&PTSX Composite.
As of December 18, 2015, the S&P500 was down 3.9% (not including dividends) for an error of -11.4 percentage points. The S&PTSX300, battered by the drop in oil and other commodity prices, was down 11.0% for an error of -17.2 percentage points.
Globally, actual stock market performance was mixed on a year-to-date basis as of December 18, 2015. Stocks performed relatively well in the Eurozone and Japan, where quantitative easing continued and monetary policy became even more accommodative. China and Korea also saw gains, although both markets are well off the double digit gains seen prior to China's August equity market rout. The US and UK, where central banks tilted toward tightening monetary policy, posted losses. Brazil, Canada, Australia and Russia suffered losses inflicted by the drop in commodity prices.
Investment Implications
While the 2015 global macro forecast misses were similar in direction and larger in magnitude relative to those of 2014, the investment implications were somewhat different. Global nominal GDP growth was once again much weaker than expected, reflecting downside forecast errors on both global real GDP growth and global inflation. In 2014, this negative development for equities was more than offset by easier than expected global monetary policy, as US and other DM equity markets performed well. In 2015, most global central banks either tightened less than expected or eased more than expected, but with the Fed signalling tightening for most of the year, weaker nominal GDP growth and the strong US dollar held the US equity market to a modest decline. In Japan and the Eurozone, where central banks continued to ease, equities outperformed. In Canada, Australia, Mexico and Russia, falling commodity prices put downward pressure on equity markets.
Similar to 2014, the downside misses on growth and inflation and the central banks easing in most countries resulted in a modest positive returns on DM government bonds in 2015, and significant outperformance of 10-year government bonds versus equities in the US, UK and Canada.
Divergences in growth, inflation and central bank responses, along with the sharp declines in crude oil and other commodity prices, again led to much larger currency depreciations versus the USD than forecast. For Canadian investors, this meant that investments in both equities and government bonds denominated in US dollars, Japanese Yen and UK Sterling, leaving the currency exposure unhedged, were winners. Big losers were Canadian and EM equities, commodities, and EM bonds denominated in local currencies.
As 2016 economic and financial market forecasts are rolled out, it is worth reflecting that such forecasts form a very uncertain basis for year-ahead investment strategies. The best performing portfolios for Canadian investors in recent years have tended to be those that are well diversified, risk-balanced and currency unhedged.
At the risk of sounding like a broken record, I am going to write again about whether Canada is, was or will be experiencing a recession.
You may wonder why I am doing this. After all, on December 1 the authoritative Peter Mansbridge, anchor of the CBC National news pronounced that the recession is "officially over", citing the report from Statistics Canada that real GDP grew 0.6% (or 2.3% at an annual rate) in 3Q15 after contracting modestly in the previous two quarters. According to this interpretation, the so-called "technical recession" meaning two (or more) consecutive quarters of negative real GDP growth, a definition widely adopted by the general media and the business press, was over.
However, I have recently joined the C.D. Howe Institute's Business Cycle Committee (BCC), which is described on the Institute's web site as "an arbiter of business cycle dates in Canada.... The Council performs a similar function to the National Bureau of Economic Research (NBER) Business Cycle Dating Committee in the United States."
This is a big responsibility and one that I take very seriously. When I told my wife about it, she was puzzled, and asked why I would want to spend my time on such an activity. She correctly pointed out that most people are more interested in what will happen in the future than in having precise dates upon which the economy entered into and exited from recessions. I explained that economists can do a better job giving guidance about the future direction of the economy if they understand the causes and dynamics of past business cycles.
I was not a member of the BCC when it issued its latest report, which concluded that "as of July 22, data did not provide evidence that Canada had entered an economic downturn", but said it would review its position later in 2015.
What is a Recession?
In a background Commentary to the first report of the Business Council Committee, Philip Cross and Phillipe Bergevin defined a recession as follows:
A recession is the phase of the business cycle when aggregate economic activity is contracting.... The drop in economic activity is a self-reinforcing process, where lower incomes lead to cuts in spending, which trigger declines in output and possibly employment, which lead to further reductions in incomes.
The Commentary goes on to cite the NBER definition of recession:
A significant decline in activity spread across the economy, lasting more than a few months, visible in industrial production, employment, real income, and wholesale-retail trade.
What these definitions have in common is that they require a "significant" contraction of economic activity, measured in four key dimensions: real output, employment, real income, and real spending or sales. To qualify as "significant", a contraction must meet the 3 P's test: it must be pronounced, pervasive, and persistent. To be pronounced, the contraction must show some depth or amplitude. To be pervasive, it must demonstrate some duration or length. To be persistent, it must show scope or breadth across the key dimensions of output, employment, real income and spending.
Cross and Bergevin note that there is an element of professional judgement in dating recessions:
Although one can use these considerations as guides in identifying and dating recessions, it is worth emphasizing that it is impractical to establish preset conditions with respect to amplitude, duration, and scope because these considerations need to be judged simultaneously and because the economy and its measurement change over time. Thus, the [business cycle] chronology we present ... is the result of a careful balancing of these different considerations.
It should be clear from this discussion that Peter Mansbridge and other media commentators were not referring to any rigorous definition of recession when they pronounced that the recession is "officially over". Indeed, it may not yet be possible to determine whether a recession "officially began" sometime in the first half of 2015, because professional judgement has not yet been made on whether it was pronounced, pervasive and persistent enough to qualify as a recession.
Toward a Made-in-Canada Definition of Recession
In the excellent work on dating recessions back to 1926 done so far by the C.D. Howe Institute's Business Cycle Council, I have one fundamental problem. Of the four key dimensions of economic activity that are key to dating a recession, the BCC has only analyzed two: real output and employment.
The reason for this seems to be that Canada lacks monthly data on real sales and real income. In the United States, the NBER does not give any significant weight to quarterly real GDP in dating recessions. It relies on monthly data for industrial production, non-farm business payrolls, real personal income, and real manufacturing and trade sales.
In Canada, we have monthly data on real GDP for both the private and public sectors and monthly data on employment by industry. Statistics Canada does not produce monthly data for real income or for real sales.
This raises two questions for me.
First, are we attempting the measure and date the "business cycle" or some broader measure of the "economic cycle" comprising both the private business sector and the public sector?
It is well known that the business sector is more cyclical than the broad economy which includes the public sector. I believe that it is the business sector that is most prone to cyclical dynamics and that this should be the focus of dating business cycles rather than the total economy. That means we should focus on measures of private sector output and employment, not measures of total real GDP and total employment. Thus, it would be possible to have a business cycle recession without experiencing a significant decline in total real output or employment.
Second, in the absence of monthly data for real income, should we not include a focus on quarterly real income measures, which Statistics Canada does produce? The quarterly national income and expenditure accounts provides both measures of output, real gross domestic product (GDP) and real gross domestic income (GDI). Using measures of real income from the quarterly national accounts allows us to move toward a "made-in-Canada" definition of the business cycle.
Canada's economy is different from the US economy. Canada is a smaller, more trade dependent and more resource dependent economy than is the United States. This means that Canada's prosperity is more dependent on movements in the terms of trade (the price of its exports relative to its imports) and the exchange rate. The effects of these movements can introduce quite different behaviour in real GDI than in real GDP. As I have argued in a previous post, looking only at real output, measured by real GDP, often misses the point, especially when there are large movements in the terms of trade and the exchange rate, as has been the case in 2014-15.
A brilliant exposition of this thinking is contained in a Statistics Canada publication which I just recently stumbled upon. The 2012 study, "Natural Resources, the Terms of Trade, and Real Income Growth in Canada: 1870 to 2010", by John R. Baldwin and Ryan Macdonald, provides a rich account of the historical development of Canada's natural resources. In addition, using annual data, it measures the contributions to real income growth arising from real output growth, terms of trade shifts and exchange rate movements. It demonstrated that over the 140 year period, real income grew substantially more than real output because over that long period of time, terms of trade and real exchange rate effects added to real income growth.
Recent changes to the presentation of the quarterly national income and expenditure accounts make the same information available on a quarterly basis back to 1981. It seems feasible that such quarterly data could be calculated at least back to 1946.
The chart below shows drawdowns from quarterly peaks in real GDP and real GDI since 1981. The drawdown is the cumulative % decline from the previous peak level.
In recent recessions, in 2000-01 and 2008-09, notice that the cumulative declines in real GDI were both larger and more protracted than the declines in real GDP. This is because, the price of commodities produced in Canada fell quite sharply and the terms of trade weakened significantly. In the most recent period, real GDP fell only modestly, by just a cumulative 0.24% over the first and second quarters of 2015, but real GDI, fell for the three consecutive quarters to 3Q15 and by a much larger 1.5%. Since the terms of trade are continuing to decline in 4Q15, this story is still unfolding and it is possible that the downturn in real GDI could deepen further.
I believe that this evidence tips the scales in favour of judging that the 2015 downturn meets the 3 P's test:
- it is pronounced, particularly in the depth of decline of real GDI;
- it is pervasive, in that monthly real GDP, monthly real manufacturing and trade sales, and quarterly real GDI all experienced declines, only employment did not (so far); and
- it is persistent, in that quarterly GDI declined for three consecutive quarters, monthly GDP declined for six of the nine months months from January through September and remained well below the December 2014 peak level.
For this reason, I believe that, based on current evidence, a recession probably did begin in early 2015. I also think that it was a more serious recession than indicated by the decline in real GDP. However, I do not believe that a definitive conclusion can yet be reached on dating the beginning and the end of the recession. Unfortunately, this nuanced conclusion is unlikely to ever be reported by Peter Mansbridge on The National.
With just two weeks left in an overly-long federal election campaign. Political leaders, economists and editorialists opine on a daily basis on the nature of the ills facing the Canadian economy and their chosen policy antidotes. Exaggerated claims about how minor policy changes will reinvigorate the Canadian economy and boost the wellbeing of the "middle class" are commonplace.
Canada recorded two consecutive quarters of modest declines real GDP in the first half of 2015. This added fuel to an inane "debate" over whether Canada is in a recession. In July, Bank of Canada Governor Stephen Poloz said this about the recession debate:
I just find the discussion quite unhelpful. It's especially unhelpful when what has happened to the economy is very narrowly defined.
Poloz said the discussion was "especially unhelpful" because the contraction was narrowly focussed on the oil and gas industry and suggested that "the fundamentals are positive and gathering pace in about 80% of the economy".
While I agree that the debate about recession is unhelpful, it for different reasons.
Canada is not experiencing a normal business cycle recession. It is experiencing a severe negative terms of trade shock.
The terms of trade refers to the price of Canada's exports relative to the price of our imports. A negative terms of trade shock occurs when a country's export prices fall relative to the prices of its imports. The terms of trade is of crucial importance to Canada, a medium sized economy that depends heavily on international trade for its growth and prosperity. In Canada's case, the terms of trade are subject to large swings. This is because a large proportion of our exports are commodity based -- oil and gas, metals and minerals, forest products and agricultural products -- and the prices of these commodities are more volatile than the prices of Canada's imports, which are predominantly finished manufacturing products -- motor vehicles, consumer goods and business machinery and equipment. In recent years, oil and gas exports have become increasingly important, accounting for 23% of Canada's goods exports in 1Q 2014, before the recent sharp decline in the price of crude oil. In total, commodity-based exports accounted for 51% of Canada's total exports.
The plunge in the world price of oil, along with weakness in prices of other commodities has dealt a severe blow to Canada's terms of trade. The chart below shows the strong link between the value (in current dollar terms) of Canada's commodity-based exports and the Bank of Canada's Commodity Price Index. Indeed, the link appears to have become even closer over the past 15 years as the development of Canada's oil sands added to its commodity exports.
The latest available data show that the Commodity Price Index was down 40% in 3Q15 from a year earlier. This implies a further significant decline in Canada's commodity-based export values, which were already down 13% from a year earlier in 2Q15.
While it is well understood that falling commodity prices hurt the value of Canada's commodity-related exports, what is less well understood is the direct effect that this has on Canada's Real Gross Domestic Income (GDI). Real GDI is total domestically-generated income, adjusted for inflation, of all sectors of the Canadian economy, including the household sector, the corporate sector and the government sector.
The chart below shows the tight relationship between the value of Canada's commodity-based exports and real GDI for the total economy.
Real GDI fell 1% from a year earlier in 2Q15. Based on the further decline in commodity prices in 3Q15 and the consequent likely further decline in commodity-based export values, real GDI growth is likely to have fallen further in 3Q15, even if real GDP growth turns positive. The only times that real GDI has fallen as sharply over the past four decades are during the 1981-82 recession, the 1991 recession, the bursting of the Tech Bubble in 2001, and the Great Recession of 2008-09.
Canada's prosperity is determined, not by real GDP which is a measure of the how much we produce, or by employment which is a measure of how many of us are working and how many hours we work, but by real GDI, a measure of the real value of the income we receive for the work that we do. The prices that we receive in world markets for the commodities that we extract, process and export are a primary determinant of real GDI growth. A terms of trade shock generated by a sharp fall in commodity prices can have just as negative an impact on Canada's prosperity as a deep business cycle recession, defined by sustained declines in production and employment.
What is also little understood is that a fall in the value of the Canadian dollar which accompanies a fall in commodity prices further erodes real GDI. As the currency weakens, the prices of imported goods, which are dominated by finished consumer goods and business machinery and equipment, rise in Canadian dollar terms. This exacerbates the drop in the terms of trade and increases downward pressure on real GDI.
This is also why BoC Governor Poloz's suggestion that the effects of the terms of trade shock are "narrowly defined" is misleading. When the price of oil and other commodities declines, the real income of oil producers in Alberta falls, but so does the purchasing power of consumers in Ontario, Quebec and other provinces, who must pay more for imported goods, services and foreign travel. The terms of trade shock is shared and spread across regions and industries by the fall in the value of the Canadian dollar. The real incomes of all Canadians suffer when the price of oil plunges and the Canadian dollar depreciates in value.
The problem for politicians and policymakers is that the negative terms of trade shock comes from outside Canada, not from changes in the behaviour of domestic consumers, corporations or governments. The current terms of trade shock has many causes, including the development of new technologies that have lowered the cost of producing oil; the decision by Saudi Arabia and other OPEC countries to continue to pump oil at a high rate rather than cut production to support the oil price; and the slowdown in China's economy which has lowered demand and prices for a broad range of commodities.
Whether or not the downturn in the global commodity super-cycle causes a business-cycle recession measured by GDP and employment is not the most important issue. The most important point to grasp is that Canada is facing a period in which the combined real income of households, corporations and governments are declining and are unlikely to rebound quickly. Even if real GDP resumes growing in the second half of 2015 and employment continues to rise, we will be producing and working more but receiving less real income for our efforts.
What the Economic Debate Should be About
The real economic issue that politicians should be facing is not whether Canada has slipped into a modest business cycle recession, but rather what is the appropriate economic policy response to a lasting negative shock to our national income caused by the fall in the prices of the commodities that we produce.
The Conservative Party wants to stay the course, keeping taxes low, encouraging home-ownership, and pursuing a balanced budget. That is a reasonable start, but does not go far enough in providing incentives to boost growth outside the resource industries.
The Liberal Party wants to raise taxes on high income earners including high-income small business owners, reshuffle child benefits to favour the "middle class", and incur deficits to fund infrastructure projects. The difficulty in this approach will be to maintain business confidence and to control deficit spending in an environment of weak GDI growth.
The New Democratic Party (NDP) wants to raise corporate taxes, impose carbon taxes, expand government's role in child care, and pursue a balanced budget. This is a difficult if not impossible set of promises to deliver on during a period of weak commodity prices.
The worst election outcome, but perhaps the most likely according to current polls, would be a coalition government of the NDP and Liberals. Coalition economic policies would likely result in higher taxes on high income earners, small businesses and corporations, increased spending on government provided child-care and infrastructure, and an early loss of control of budget deficits.
All three political parties and all Canadian voters would be well advised start thinking about what kind of pro-investment, pro-growth policies Canada needs to pursue in a period when the main economic engine and source of national prosperity has stalled and shifted into reverse.
Global ETF portfolios for Canadian investors turned in mixed performances in 3Q15. Equity-heavy portfolios incurred losses, while bond-heavy, risk balanced portfolios posted gains. Performance would have been much worse had it not been for the 6.2% depreciation of the Canadian dollar relative to the USD that increased C$ returns for Canadian investors in USD denominated global ETFs.
As in 2Q15, global economic developments were mixed but, once again, generally disappointing:
- The forecast for global real GDP growth in 2015 fell further in 3Q. Eight of the twelve large economies that I track saw downward revisions in their 2015 growth forecast. The US growth forecast edged up in 3Q after upward revisions to 2Q growth. However, real GDP growth forecasts for 2015 were revised down for the Eurozone, Japan, Canada, Australia, China, Korea, Brazil and Russia in 3Q15.
- Signs of weaker global growth, and particularly weaker Chinese growth, contributed to a fall back in crude oil prices following a modest recovery in 2Q15.
- Forecasts of 2015 inflation fell in nine out of the twelve countries in 3Q15 as oil prices fell back and deflation worries increased.
- China, Canada and Russia cut their policy rates in 3Q15, while Brazil was again forced to hike its policy rate in response to rising inflation and a weakening currency.
- Bond yields fell virtually everywhere in 3Q15, after rising virtually everywhere in 2Q15.
- China's equity market continued its' sharp correction that began in the final weeks of 2Q, falling by over xx% from its highs. The PBoC devalued the CNY sending shock waves through global markets.
- Emerging market turbulence, especially in China, combined with confusion over Fed policy added to worries about corporate earnings and triggered corrections in major global equity markets.
Despite below target inflation, the Fed continued to stress the need for "policy normalization". The window appeared to be open for a rate hike in September after growth rebounded in 2Q and employment gains remained strong through August. However, the Fed passed on the opportunity, apparently concerned that in light of China's growth slowdown and emerging market financial outflows, a Fed rate hike might further destabilize global financial markets. In the event, the non-action by the Fed appeared to exacerbate concerns of global growth slowdown, and sent equity markets into a further tailspin.
The Bank of Canada followed up on a January rate cut with a second 25 basis point easing in July, as it became increasingly apparent that the economy had suffered a second consecutive modest contraction in 2Q. The Canadian dollar, which had firmed versus the USD in 2Q on moderately higher crude oil prices, came under renewed downward pressure in 3Q as China's growth slowed and oil prices fell back.
Global Market ETFs: Performance for 3Q15
In 3Q15, with global growth and inflation expectations weakening, crude oil prices falling, and the USD appreciating by 6.6% against the CAD, the best global ETF returns for Canadian investors were in US government and investment grade corporate bonds. The worst returns were in commodities and Emerging Market equities. The chart below shows 3Q15 and year-to-date returns in CAD terms, including reinvested dividends, for the ETFs tracked in this blog.
In CAD terms, 11 of 19 ETFs posted losses, while 8 posted gains. In local currency terms, only 3 of the 19 RTFs posted gains.
The best returns, in CAD terms, were in US Long Teasury Bonds (TLH) +10.6%; US Investment Grade bonds (LQD) +7.8%; non-US Developed Market bonds (BWX) +6.7%; and US Inflation-linked bonds (TIP) +5.6%.
The worst losses were in the commodity ETF (GSG), which returned -13.8% in CAD, and the Emerging Market equity ETF (EEM), which returned -11.8%.
All of the Canadian ETFs that we track posted losses in 3Q15, but Canadian bond ETFs outperformed Canadian equity ETFs. The Long Bond ETF (XLB) returned -0.3%; the Real Return bond (XRB) -0.6%; the Corporate bond (XCB) -0.8%; while Canadian equities (XIU) returned -6.8%.
Global ETF Portfolio Performance
In 3Q15, the global ETF portfolios tracked in this blog posted mixed returns in CAD terms, when USD currency exposure was left unhedged.
When USD exposure was hedged, the portfolios all posted negative returns. In a November post, we explained why we prefer to leave USD currency exposure unhedged in our ETF portfolios.
The traditional Canadian 60% Equity/40% Bond ETF Portfolio lost 2.3% in CAD when USD exposure was left unhedged, but lost 5.2% if the USD exposure was hedged. A less volatile portfolio for cautious investors, the 45/25/30, comprised of 45% global equities, 25% government and corporate bonds and 30% cash, lost 1.1% if unhedged, but lost 4.1% if USD hedged.
Risk balanced portfolios outperformed in 3Q15 if USD exposure was left unhedged. A Levered Global Risk Balanced (RB) Portfolio, which uses leverage to balance the expected risk contribution from the Global Market ETFs, gained 1.6% in CAD terms if USD-unhedged, but lost 5.0% if USD-hedged. An Unlevered Global Risk Balanced (RB) Portfolio, which has less exposure to government bonds, ILBs and commodities but more exposure to corporate credit, gained 0.1% if USD-unhedged, but lost 4.6% if USD-hedged.
Despite their 3Q15 losses, all of the global ETF portfolios retained gains for the year-to-date in CAD terms if USD exposure was left unhedged. Year-to-date returns ranged from a high of 9.3% for the Levered Risk Balanced Portfolio to a low of 3.5% for the conservative 45/25/30 portfolio. If the portfolios were USD hedged, they all posted year-to-date losses, ranging from -3.0% for the 60/40 portfolio to -4.9% for the Levered Global Risk Balanced Portfolio. Interestingly, the Levered Global Risk Balanced Portfolio is the best year-to-date performer if USD unhedged, but the worst performer if USD hedged.
Recent Performance in Perspective
The mixed 3Q15 performance of the USD unhedged global ETF portfolios was driven by two factors: the fall in bond yields as global, and particularly Chinese growth, continued to slow; and the sharp weakening of the CAD versus USD as the Canadian economy contracted for two consecutive quarters, the Bank of Canada delivered another rate cut, and price of crude oil and other commodities fell.
Fed and BoC policy continue to tilt in opposite directions. US real GDP growth, while disappointing, is still expected to reach 2.5% in 2015, double that expected in Canada. However, weak September readings for the ISM manufacturing PMI and US nonfarm payrolls, suggest that the US economy is losing momentum again. While Canada's economic data has firmed so far in 3Q, the RBC manufacturing PMI showed a sharp contraction in September as the negative effects of lower crude oil prices continued to weigh on economic activity. While some Fed officials have resumed signalling a rate hike before year end, a US tightening this year is clearly in doubt. The BoC seems much more likely to cut rates again than to raise them over the next six months.
Three months ago, I said "As we enter 3Q15 in a continuing uncertain environment, characterized by sluggish global growth and divergent central bank policies, and with rich valuations for US equities, remaining well diversified with an ample cash position continues to be a prudent strategy." As 4Q15 begins, that still seems to be the scenario that is playing out.
The more conservative 45/25/30 portfolio (which I have favoured) was less volatile and incurred smaller losses in 3Q15 than the more aggressive 60/40 portfolio. The Risk Balanced portfolios outperformed because of their larger positions in government, corporate bonds and inflation-linked bonds. As we enter 4Q15, the environment remains uncertain, characterized by weak and divergent global growth and central bank policies. US equity valuations have become less stretched but are still expensive. Global recession risks are rising, not falling as expected by the consensus. Remaining well diversified with substantial US dollar exposure and an ample cash position continues to be a prudent strategy.
First, let me say that the Bank of Canada should get full marks for correctly anticipating the need to cut the policy rate to 0.75% in January and again to 0.50% in July. Many economists criticized the BoC for acting too soon and/or for surprising markets. But now, with the benefit of hindsight, it is clear that Governor Poloz and his colleagues provided timely and appropriate monetary easing.
While I have advocated rate cuts since early January and believe that additional easing may be needed, I think that the BoC should pause for now. I'll state my case by first reviewing the case for an additional rate cut now, then reviewing the case for standing pat, and finally by outlining some additional strategic considerations.
The Case For a September Policy Rate Cut
Economic data available through September 1 provide support for another rate cut.
Real GDP contracted modestly for a second consecutive quarter in 2Q15. This has touched off a lively debate in the financial pages over whether this meets the definition of a recession. Some say that, at least, Canada is in a "technical recession", which they define as two consecutive negative quarters of real GDP growth. But this is an arbitrary definition latched onto by the press because it is simple to understand. More sophisticated analysts use the National Bureau of Economic Research definition, which says that for a recession to be confirmed in the judgement of a panel of qualified business cycle economists, there must be "a significant decline in economic activity spread across the economy, lasting more than a few months, normally visible in real GDP, real income, employment, industrial production, and wholesale-retail sales". So far, industrial production and real incomes have fallen while employment and sales have held up. It normally takes a year or more for a recession to be confirmed and it is far too soon to render such a judgement for Canada.
More important than whether the economy is in recession is the fact that, by the Bank of Canada's latest estimate, the output gap worsened to -2.2% at the end of 2Q15 from -1.1% at the end of 4Q14. The economy was twice as far away from the BoC's definition of full capacity at mid-year than it was when the year began. This is the most compelling rationale for the easing that has already occurred and possibly for the need for additional monetary ease.
Inflation, measured by the annual change in the CPI, averaged just 0.9% in 2Q15, before edging up to 1.3% in July. That is well below the Bank of Canada's 2% inflation target. Inflation expectations remain muted based on survey data and falling breakeven yields on real return bonds.
Commodity prices, after firming in 2Q15, have resumed the plunge that began a year ago in 3Q. As readers of this blog know, in my opinion this is one of the most important leading indicators for the Canadian economy. Canada is a small open economy. Commodity-based products make up a large proportion of Canada's exports, while finished consumer goods and business machinery and equipment make up a large proportion of Canada's imports. When commodity prices fall relative to prices of finished consumer goods and machinery and equipment, Canada suffers a reduction in its terms of trade. This has a direct negative impact on real national income.
The chart below shows that the Commodity Terms of Trade (CToT), which I define as the Bank of Canada's Commodity Price Index divided by the Core CPI, has renewed its' sharp decline and has fallen to a level below that seen at the depth of the 2008-09 Great Financial Crisis (GFC). The Canadian dollar has appropriately weakened along with the CToT to cushion the blow on the commodity producing industries. The weaker currency also spreads the effect of the CToT decline across the economy by reducing the real purchasing power of Canadian dollar incomes of consumers and businesses. This should also, over time, encourage a redeployment of resources out of the commodity-based sectors into now more internationally competitive manufacturing and tradable services. But this will take time.
For these reasons -- a widening output gap, low inflation and a further sharp decline in the Commodity ToT -- another rate cut by the Bank of Canada is easily defensible.
The Case Against a September Rate Cut
Although real GDP growth was negative in 2Q15, there were some bright spots in the economy. Total hours worked (the best measure of employment) grew at a 2.1% annual rate in 2Q after just 0.3% in 1Q. Retail and wholesale sales volumes rebounded to moderate growth after contracting in 1Q. Housing starts picked up after dropping sharply in 1Q. Real export volume edged up after dropping in the two previous quarters. Data through July show that 3Q was on track for a further gain in total hours worked, some improvement in manufacturing activity, and solid housing starts.

The Bank of Canada's measure of core inflation has moved up to 2.4% in July, from 2.3% in 2Q, and 2.2% in 1Q. This worries some economists. Core inflation is supposed to be a better guide to future inflation than the current total CPI inflation rate. But this is often not true for Canada, especially during sharp moves in commodity prices. When commodity prices fall sharply and the Canadian dollar weakens, prices of imported consumer goods rise in Canadian dollar terms even if they are stable in the currency of the exporting country. So as commodity prices have fallen, prices of many imported products in the Core CPI have been pushed up. This is the anomaly for Canada: when oil and other commodity prices fall, core CPI inflation is temporarily pushed up by the appropriately weakening Canadian dollar. When oil prices and the Canadian dollar stabilize, core inflation will come down. So the current 2.4% core CPI inflation rate is not a good guide to where inflation will be in the future. On the contrary, it is giving a misleading signal. Nevertheless, some economists have used the elevated level of the core CPI to argue against further easing of monetary policy.
For these reasons -- signs of some improvement in the economy in early 3Q data and an above-target core CPI inflation rate -- it is possible for some economists to recommend that the BoC should hold the policy rate at 0.50% in September.
Additional Strategic Considerations
In my opinion, the Bank of Canada should pause for now. This is not because I believe that the case for standing pat outlined above is stronger than the case for another cut. It is for the following reasons:
First, the economic impact of the financial market volatility seen in August -- especially the sharp drop in commodity markets and global equity markets led by China -- will not become clear until more data becomes available for 3Q15. One assumes that such volatility will tend to dampen global growth, particularly in commodity exporting economies and those with strong trade ties to China. However, the impact on advanced economies, including the US, Eurozone and Japan is not so clear, as these economies tend to benefit from lower commodity prices.
Second, Canada is in the midst of a federal election campaign with the vote scheduled for October 19. The incumbent Conservative party is in a three-way fight with the left-leaning New Democratic Party (NDP) and the Liberal Party. The three parties have quite different ideas about fiscal policy. The Conservatives favour pursuing a balanced budget, although they have in the past permitted the deficit to rise during periods of recession. The Liberals favour increased infrastructure spending and allowing budget deficits of "up to $10 billion" per year for at least two years to support the economy. The NDP favour increased spending on a national child-care program and greater support for municipalities funded by increased corporate and gasoline taxes. The NDP has had an early lead in opinion polls, although this may be shrinking. Nevertheless, the election outcome is highly uncertain and the eventual policy changes, if any, are unpredictable. Some observers, including myself, believe that a minority government led by the NDP or in some coalition with the Liberal Party, could have a substantial negative impact on business confidence and investment spending, not unlike what happened when the NDP formed governments in Ontario (1990-95) and British Columbia (1991-2001). This has the potential to further weaken the Canadian dollar and to prolong and deepen the current economic downturn.
Third, the Bank of Canada needs a game plan to deal with the possibility of a further weakening of the Canadian economy. Just one more 25 basis point policy rate cut will return the policy rate to its GFC low of 0.25%. This will not be enough easing to deal with a further weakening of the economy. The Bank needs to consider a wide range of options, including: moving to a zero or even negative policy rate; policy rate guidance that commits to holding the policy rate at an exceptionally low level for an extended period of time; and various forms of quantitative easing.
Conclusion
The Bank of Canada has performed its role of stabilizing inflation and economic activity admirably so far in 2015. In doing so, it has used a couple of its' few remaining bullets. At this stage, despite a strong case for additional easing, I believe that the Bank should hold its fire until after the federal election. By this time, it will be possible to judge the impact of the renewed plunge in commodity prices, the impact of recent financial volatility on global growth, and the likely future stance of fiscal policy.
Make no mistake about it. This is a challenging moment for the Canadian economy. What is not needed, is for the Bank of Canada to inject itself into the midst of the election campaign with a policy rate move that will inevitably become a political football.
Just a quick update to indicate that, in my opinion, the Bank of Canada's 25 basis point rate cut to 0.50% was quite appropriate.
I had recommended that the BoC cut to 0.50% as early as last March and again recently when the C.D. Howe Monetary Policy Council met last week.
Why do I think it was appropriate? To update the analysis from my recent post titled "Equilibrium Real Policy Rates: Does Anybody Really Know", the Taylor Rule for the appropriate policy rate, as cited recently by Fed Chair Janet Yellen is:
The current policy rate (R) should = the equilibrium real policy rate (RR*) + core inflation (π) + 0.5 * the gap between current inflation and target inflation (π - π*) + 0.5 * output gap (y).
Today's Monetary Policy Report provided the inputs required to calculate the appropriate policy rate. Using assumptions, along the lines of those used by Ms. Yellen, that the equilibrium real policy rate is close to 0% currently; that the underlying trend in inflation is assessed to be 1.5 to 1.7% (p. 15) and that the Canadian output gap is -2.2% (p. 20), the current policy rate should be 0.30% or (0 + 1.6 - 0.2 - 1.1), or slightly lower than the 0.5% that the Bank of Canada set today.
With the economy clearly in a marked slowdown and with a federal election looming in October, the Bank of Canada was wise to take out additional insurance to bolster the economy now. If growth recovers strongly later this year, the BoC may eventually be in a position to reverse the quite appropriate easing that has been provided since January.
Economic forecasting is easy. Anyone can fill in a spreadsheet with their best guesses of how GDP growth, inflation, and central bank policy rates will unfold and call it a forecast. There are no professional standards or guidelines that must be met to publish a forecast. An economist I once knew often said his goal in making forecasts was to be "100% memorable and 51% accurate".
Forecasting accurately is extremely difficult. This is partly because unexpected events or shocks are constantly buffeting economies. It is partly because economic data is published with some delay and is often significantly revised later, especially at cyclical turning points. This means that, at any point in time, even analysts who follow the economic data closely have an unclear picture of the current state of the economy which is the starting point for their forecasts. This makes it more difficult, even for the best analysts, to accurately foresee inflection points in growth and inflation.
As I have written elsewhere, another issue for forecasters is what is known as the "optimism bias". The optimism bias in economic forecasts is well documented and widespread. In a 2011 study for the US National Bureau of Economic Research, Jeffrey Frankel found that for 33 countries, on average, the upward bias in real GDP forecasts is 0.4% when looking one year ahead, 1.1% at the two-year horizon and 1.8% at three years. Despite Frankel's findings, forecasters retain their optimism bias. In recent years, this bias has had a seasonal component, with optimism seemingly peaking in December-January as year ahead forecasts are publicized. 2015 is proving no different.
The table below presents revisions in 2015 growth and inflation forecasts for the twelve economies that I regularly monitor in this blog.
Growth Forecast Revisions
The table compares forecasts made at the turn of the year with revised forecasts published last week by two of the very best global forecasting organizations, the International Monetary Fund (IMF) and JP Morgan Economics (JPM). For real GDP growth, there are substantial downward revisions across a wide range of countries. [Note that revisions to global growth are smaller, but this appears to be due to shifts in purchasing power parity (PPP) weights toward higher growth economies like China and India].
With all of the recent angst over Grexit and the bursting of China's stock market bubble, it is perhaps surprising that the largest downward growth revisions are not in Europe or Asia, but instead in the Western Hemisphere. The most significant downward revision is for the world's largest economy, the United States. The IMF has downgraded its' dizzying 3.6% forecast for US growth to 2.4%, while JPM has cut from 3.0% to 2.2%. The downgrade to US growth has cascaded through the hemisphere, with Mexico downgraded from robust to moderate growth, Canada downgraded from moderate growth to near-recession, and Brazil downgraded from virtually no growth to outright recession.
By comparison, growth downgrades are more moderate for Japan, the UK, Australia and Korea. There is a notable growth upgrades for India. Growth forecasts for the Eurozone and China are little changed, as is Russia's recession forecast.
This is where the optimism bias continues to rear its' head. Do forecasters really believe that the disappointments in Western Hemisphere are over and that the recent turmoil surrounding Greece and China will have no impact on Eurozone and Chinese growth? Could the turmoil be a harbinger of further problems within these large economies?
Inflation Forecast Revisions
Revisions to inflation forecasts are more mixed. The big change to factor into 2015 inflation forecasts has been the collapse in the price of crude oil over the past year. Most of the decline had occurred by early in 2015 and was being taken into account in turn of the year forecasts. These forecasts have been complicated by the effects of some large exchange rate movements.
On balance the largest downward revisions to end-2015 CPI inflation forecasts have been in the UK, Mexico, Australia and India. These downward revisions have been offset by large upward revisions to year-end inflation forecasts for Russia and Brazil, where exchange rate depreciation is pushing up inflation despite the economies being in recession.
There is no change in China's 2015 inflation forecast at 1.7%, despite inflation having averaged just 1.3% in the first six months of the year and despite clear signs that growth is slowing, that house prices are falling and that confidence has been shaken by the recent stock market crash.
Implications for Monetary Policy
The forecast revisions since the beginning of the year mainly reflect disappointment that overly optimistic growth forecasts have not been met. From a policy perspective, this has meant unexpected monetary policy easing in some countries and a delay in tightening policy in others. Among the economies monitored here, central banks of Canada, Australia, Korea, India and Russia have all provided policy rate cuts that were not expected at the beginning of the year, while Japan and the Eurozone have added to their QE bond purchase programs. The US and UK have delayed raising their policy rates.
Implications for Markets
In this environment of widespread downward revisions to growth forecasts, more moderate and mixed revisions to inflation forecasts and unexpected easing of monetary policy, asset markets have provided little gain and plenty of volatility. The chart below shows year-to-date ETF returns for the the major asset classes in both USD terms (green bars) and CAD terms (blue bars).
With the exception of Japanese equities (EWJ, which returned over 12%), USD returns on these ETFs have been weak, ranging from -8% for Canadian equities (XIU) to +4% for US Small Cap stocks (IWM). Of course, when a 9% appreciation of the USD vs CAD is factored in, Canadian dollar investors (who did not currency hedge) enjoyed positive returns on all of these ETFs.
Commodity returns were negative in USD terms. Eurozone (FEZ) and Emerging Market (EEM) equity returns were negative. Inflation-linked bond ETF returns were negative. Credit ETF (LQD and XCB) returns were negative in USD terms, with the exception of US High Yield (HYG). In Emerging Market bonds, those denominated in USD (EMB) had positive returns, but those denominated in local EM currencies had negative returns. US 10-year Treasury bonds (TLH) and non-US government bonds (BWX) also had negative returns in USD terms.
High Hopes Dashed, Uncertainty Remains
Hopes raised by the giddy economic forecasts made at the turn of the year have been dashed. Only those investors who played the currencies correctly have made any money this year; the underlying asset values have been eroded by disappointing growth, weak commodity prices, and fears that (sometimes desperate) monetary policy easing will be ineffective and/or ultimately reversed.
The biggest question mark for the remainder of the year is China. The bursting of the previously surging Chinese equity bubble has led the government to take unprecedented steps to stabilize the stock market that could yet backfire. A full-blown Chinese financial crisis would be devastating to still optimistic global growth and inflation forecasts.


